|
|
Type 1 Gage StudyGraphs - Capability |
The capability indices consist of:
These values indicate whether your measurement system is capable of measuring parts consistently and accurately.
Example Output |

Interpretation |
|
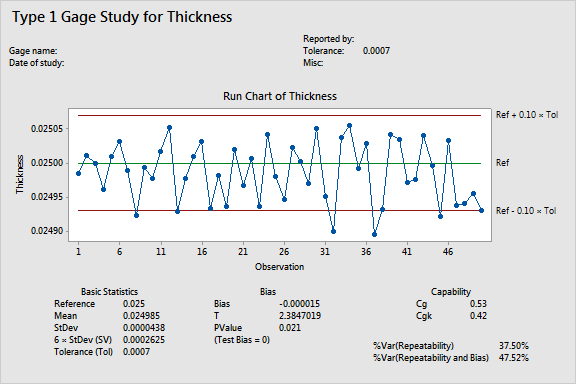
For the thickness data, both indices are smaller than the typical threshold of 1.33 (Cg = 0.53 and Cgk = 0.42); your measurement system is not capable and needs improvement.
In this example, %Var (Repeatability) = 37.50% and %Var (Repeatability and Bias) = 47.52%. These values are much larger than 15%, which again suggests that the variation due to the measurement system is large.
These results indicate that the measurement system can not measure parts consistently and accurately and should be improved.