main topic
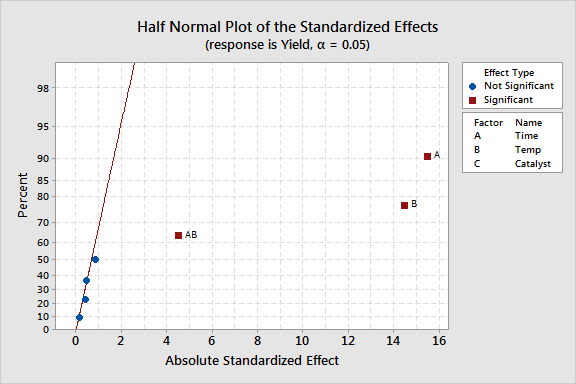
In the half normal plot of the effects, points that do not fall near the line usually indicate significant effects. Such effects are larger and generally further from the fitted line than unimportant effects. Insignificant effects tend to be smaller and close to zero. In a half normal plot, all the significant effects are labeled and fall toward the right.
If there is no error term, Minitab uses Lenth's method [5] to identify significant effects. If there is an error term, Minitab uses the corresponding p-values that are shown in the Session window to identify significant effects. The half normal plot uses a = 0.05, by default. You can change the a-level by changing the confidence level in the Options subdialog box or by setting a in the Stepwise subdialog box.

This plot shows that terms A, B, and AB are significant and are in the model. Term C is not significant but is in the model. Terms AC, BC, and ABC are not in the model. The absolute standardized effect for Factor A is greatest, so Factor A is the most statistically significant.
|
Note |
If the standard errors of the coefficients are zero, Minitab does not display the half normal effects plot. |