main topic
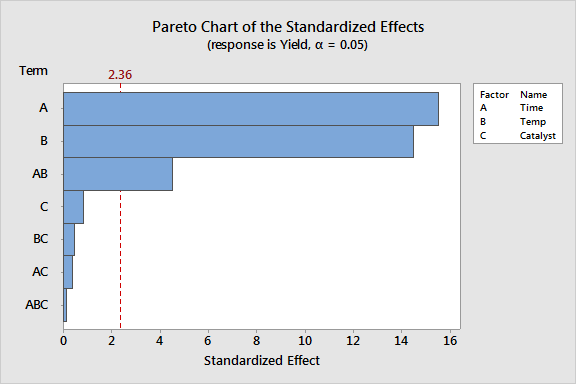
Use a Pareto chart of the effects to determine the magnitude and the importance of an effect. The chart displays the absolute value of the effects and draws a reference line on the chart. Any effect that extends past this reference line is statistically significant.
The method Minitab uses depends on whether an error term exists:

This plot shows that terms A, B, and AB are significant.
|
Note |
If the standard errors of the coefficients are zero, Minitab does not display the reference line on the Pareto plot. |