main topic interpreting results session command see also
You are an engineer assigned to optimize the responses from a chemical reaction experiment. You have determined that three factors - reaction time, reaction temperature, and type of catalyst - affect the yield and cost of the process. You want to find the factor settings that maximize the yield and minimize the cost of the process.
You do not need to analyze these factorial design models. The worksheet contains the models for the response optimizer.
1 Open the worksheet FACTOPT.MTW.
2 Choose Stat > DOE > Factorial > Response Optimizer.
3 For the cost, under Goal, choose Minimize.
4 For the yield, under Goal, choose Maximize.
5 Click Setup. Complete the Lower, Target, and Upper columns of the table as shown below:
|
Response |
Lower |
Target |
Upper |
|
Cost |
|
28 |
35 |
|
Yield |
35 |
45 |
|
6 Click OK in each dialog box.
Session Window Output
|
Graph Window Output

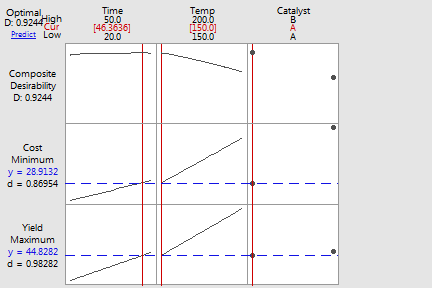
The individual desirabilities appear on the response optimization plot. The desirability for Yield is 0.98282 and the individual desirability for Cost is 0.86954. The composite desirability for both of these two variables is 0.924449.
To obtain this desirability, you would set the factor levels at the values shown under Solution in the Session window. That is, time would be set at 46.3636, temperature at 150, and you would use catalyst A.
If you want to try to improve this initial solution, you can use the plot. Move the red vertical bars to change the factor settings and see how the individual desirabilities and the composite desirability change. Click Predict on the graph to calculate the response values for the new solution.
The response optimizer uses model equations. Ensure that your models are adequate before you interpret the results.