main topic interpreting results session command see also
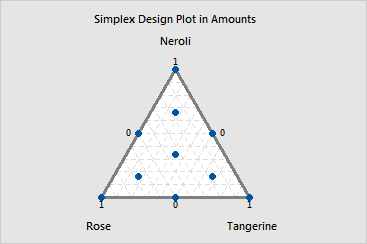
In the Example of a simplex centroid design, you created a design to study how the proportions of three ingredients in an herbal blend household deodorizer affect the acceptance of the product based on scent. The three components are neroli oil, rose oil, and tangerine oil. To help you visualize the design space, you want to display a simplex design plot.
1 Open the worksheet DEODORIZ.MTW.
2 Choose Stat > DOE > Mixture > Simplex Design Plot. Click OK.
Graph window output

The simplex design plot shows that there are ten points in the design space. The points are as follows: