main topic interpreting results session command see also
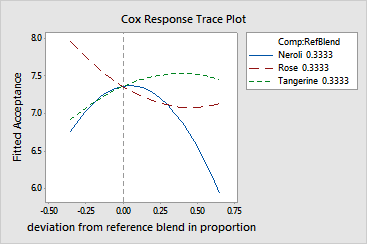
In the Example of a simplex centroid design, you created a design to study how the proportions of three ingredients (neroli oil, rose oil, and tangerine oil) in an herbal blend household deodorizer affect the acceptance of the product based on scent. Next, you analyzed the response (Acceptance) in the Example of analyzing a simplex centroid design. Now, to help you visualize the component effects, you display a response trace plot.
1 Open the worksheet DEODORIZ2.MTW.
2 Choose Stat > DOE > Mixture > Response Trace Plot.
3 Click OK.
Graph window output

The trace plot shows how each component effects the response relative to the reference blend. The reference blend is shown in the legend of the plot. In this example, the reference blend is the centroid of the design vertices; each component represents 0.33 of the total. This trace plot provides the following information about the component effects. Starting at the location corresponding to the reference blend:
- increases (and the other mixture components decrease), the acceptance rating of the deodorizer decreases
- decreases (and the other mixture components increase), the acceptance rating of the deodorizer decreases
The proportion of neroli oil in the reference blend is near optimal.
- increases (and the other mixture components decrease), the acceptance rating of the deodorizer decreases slightly
- decreases (and the other mixture components increase), the acceptance rating of the deodorizer increases
A decrease in the proportion of rose oil relative to the reference blend may improve the acceptance rating.
- increases (and the other mixture components decrease), the acceptance rating of the deodorizer increases slightly
- decreases (and the other mixture components decrease), the acceptance rating of the deodorizer decreases
An increase in the proportion of tangerine oil relative to the reference blend may improve the acceptance rating.
Keep the following in mind when you are interpreting a response trace plot: