main topic interpreting results session command see also
The compound normally used to make a plastic pipe is made of two materials: Material A and Material B. As a research engineer, you would like to determine whether or not a filler can be added to the existing formulation and still satisfy certain physical property requirements. You would like to include as much filler in the formulation as possible and still satisfy the response specifications. The pipe must meet the following specifications:
Using an augmented simplex centroid design, you collected data and are now going to optimize on three responses: impact strength (Impact), deflection temperature (Temp), and yield strength (Strength).
1 Open the worksheet MIXOPT.MTW. (The design, response data, and model information have been saved for you. The data are from [1].)
2 Choose Stat > DOE > Mixture > Response Optimizer.
3 Click ![]() to move
Impact, Temp,
and Strength to Selected.
to move
Impact, Temp,
and Strength to Selected.
4 Under Model Fitted in, choose Pseudocomponents.
5 Click Setup. Complete the Goal, Lower, Target, and Upper columns of the table as shown below:
|
Response |
Goal |
Lower |
Target |
Upper |
|
Impact |
Maximize |
1 |
3 |
|
|
Temp |
Maximize |
190 |
200 |
|
|
Strength |
Maximize |
5000 |
5200 |
|
6 Click OK in each dialog box.
Session Window Output
Response Optimization
Parameters
Goal Lower Target Upper Weight Import Impact Maximum 1 3 3 1 1 Temp Maximum 190 200 200 1 1 Strength Maximum 5000 5200 5200 1 1
Global Solution
Components
Mat-A = 0.45 Mat-B = 0.55 Filler = 0
Predicted Responses
Impact = 6.04 , desirability = 1.000000 Temp = 213.19 , desirability = 1.000000 Strength = 6045.18 , desirability = 1.000000
Composite Desirability = 1.000000 |
Graph Window Output

In most cases, Minitab uses the units that are displayed in the worksheet for the numerical optimization and optimization plot results. However, if you have a design that is displayed in amounts and you have multiple total amounts, the components are displayed in proportions for both the numerical optimization and the optimization plot results. In this example, the results are displayed in proportions.
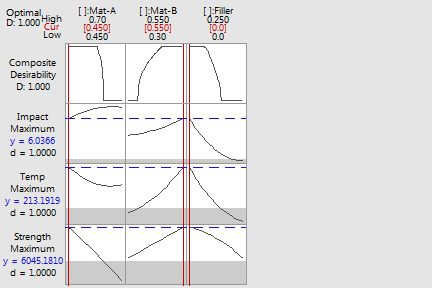
The individual desirabilities and the combined or composite desirability of the three response variables are 1.0. The gray regions on the graph indicates factor settings where at least one response has zero desirability.
To obtain this composite desirability, you would set the mixture component proportions at the values shown under Global Solution in the Session window output. The proportions of the three ingredients in the formulation used to make the plastic pipe would be: 0.45 of Mat-A; 0.55 of Mat-B, and 0.0 of Filler. The predicted responses for the formulation are: impact strength = 6.0366, deflection temperature = 213.1919, and yield strength = 6045.1810. These predicted responses indicate that the physical property specifications of the plastic pipe have been met.
However, the objective of the experiment is to include as much filler in the formulation as possible and still satisfy the response specifications. Although you have satisfied the response specifications, the resulting formulation does not include any filler. You can move the vertical bars to change the component proportions and see whether or not you can add more filler and still satisfy the specifications.
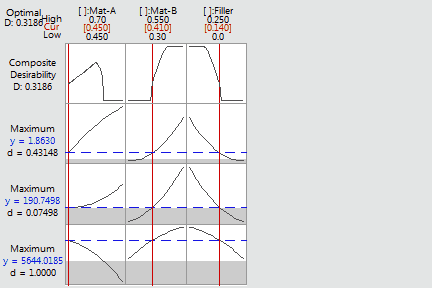
In the plot below, filler has been locked at .14 and the vertical bars have been moved to determine the proportions of a formulation with lower desirability, but one that still meets the required specifications. You can continue to change the formulation until you find a combination of proportions that fit your needs.
