main topic session commands see also
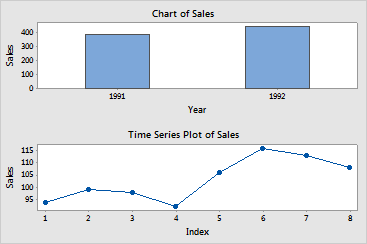
Suppose you want to create a bar chart and time series plot for a presentation. You want both graphs to appear on the same page, so you create the graphs and then use the layout tool.
Step 1: Create the graphs
1 Open the worksheet NEWMARKET.MTW.
2 Choose Graph > Time Series Plot.
3 Choose Simple and then click OK.
4 In Series, enter SalesB. Click OK.
5 Choose Graph > Bar Chart.
6 Under Bars represent, choose Values from a table.
7 Under One column of values, choose Cluster and click OK.
8 In Graph Variables, enter SalesB.
9 In Categorical variable, enter Year. Click OK.
Step 2: Create the layout
1 Choose Editor > Layout Tool.
2 In Rows, enter 2.
3 In Columns, enter 1.
4 In the list box, double-click Time Series Plot of Sales. (Chart of Sales already appears in the layout.)
5 Click Finish.
Graph window output
