main topic session commands see also
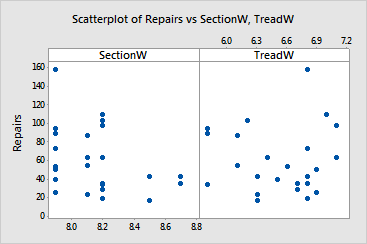
Suppose you want to plot both section and tread width against tire repairs. You want the plots to appear in the same graph, but in separate panels.
1 Open the worksheet TIRES.MTW.
2 Choose Graph > Scatterplot.
3 Choose Simple and click OK.
4 In row 1 of Y, enter Repairs. In row 1 of X, enter SectionW.
5 In row 2 of Y, enter Repairs. In row 2 of X, enter TreadW.
6 Click Multiple Graphs.
7 Under Show Graphs of Different Variables, choose In separate panels on the same page. Click OK in each dialog box.
Graph window output
