main topic see also
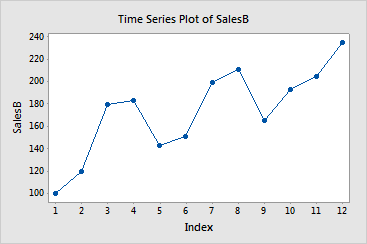
Suppose you have created a time scale plot of sales by quarter and year, starting with the first quarter of 2000. You would like to change the time scale to a generic index without reference to year.
Step 1: Create the graph
1 Open the worksheet NEWMARKET.MTW.
2 Choose Graph > Time Series Plot > choose Simple > OK.
3 In Series, enter SalesB.
4 Click Time/Scale, then click the Time tab.
5 Under Time Scale, choose Calendar. From the menu, choose Quarter Year.
6 Under Start Values, choose One set for all variables.
7 Under Quarter, type 1. Under Year, type 2000.
8 Click OK in each dialog box.
Step 2: Edit time
1 Double-click the time scale.
2 Click the Time tab.
3 Under Time Scale, choose Index.
4 Click OK.
Graph window output
