main topic session commands see also
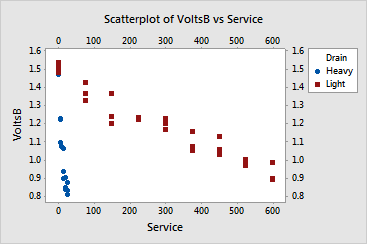
From the Scale subdialog box, you can specify which scale components to display on your graph. By default, major ticks and tick labels are shown only on the low sides of the graph. In this example, you add these items to the high sides of the graph.
1 Open the file BATTERIES.MTW.
2 Choose Graph > Scatterplot.
3 Choose With Groups, and click OK.
4 In Y, enter VoltsB. In X, enter Service.
5 In Categorical variables for grouping (0-3), enter Drain.
6 Click Scale, then click the Axes and Ticks tab.
7 Under Y Scale, High, and X Scale, High, check Major ticks and Major tick labels. Click OK in each dialog box.
Graph window output
