main topic session commands see also
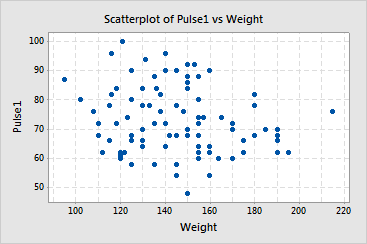
Suppose you want to include a scatterplot in a presentation. To ensure that points are easily related to their respective values on both scales, you add gridlines.
1 Open the worksheet PULSE.MTW.
2 Choose Graph > Scatterplot.
3 Choose Simple and click OK.
4 In Y, enter Pulse1.
5 In X, enter Weight.
6 Click Scale, then click the Gridlines tab.
7 Under Show gridlines for, check all items except Y minor ticks.
8 Click OK in each dialog box.
Graph window output
