main topic interpreting results session commands see also
You need to plot your sales using the date format qQyy for the time scale; for example, 4Q00 stands for the fourth quarter of 2000. You enter a column in Minitab called Date and use this column for a stamp on the time series plot.
|
Note |
You can also use a stamp with area graphs or control charts. |
1 Open the worksheet NEWMARKET.MTW.
2 Choose Graph > Time Series Plot.
3 Choose Simple, then click OK.
4 In Series, enter SalesB.
5 Click Time/Scale.
6 Under Time Scale, choose Stamp.
7 In Stamp columns (1-3), enter Date. Click OK in each dialog box.
Graph window output
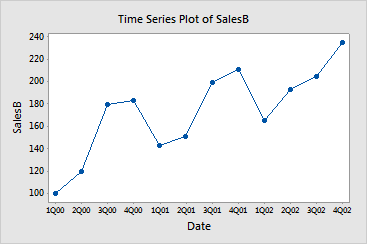
The tick marks on the x-axis are labeled with values from the stamp column.