main topic interpreting results see also
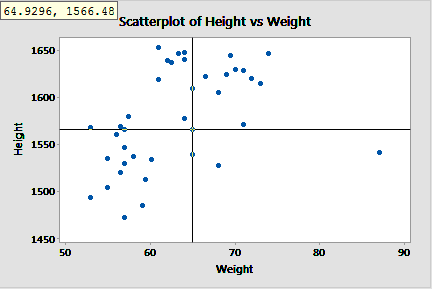
Suppose you create a large scatterplot of weight and height data. Creating enough reference lines to identify the coordinates of each point would clutter the graph, so you opt to use crosshairs.
1 Open the worksheet PERU.MTW.
2 Choose Graph > Scatterplot.
3 Choose Simple, then click OK.
4 In Y variables, enter Height; in X variables, enter Weight. Click OK.
5 Choose
Editor > Crosshairs, or click
![]() on the Graph Editing toolbar.
on the Graph Editing toolbar.
6 Place the crosshairs over a point of interest. The coordinates of the crosshairs appear in the upper left corner of the graph.
Graph window output

You now know the precise coordinates of the point in question. The crosshairs also help you visualize the number of points above and below the selected point on both axes. After exploring the data in this manner, you may choose to add reference lines.