main topic see also
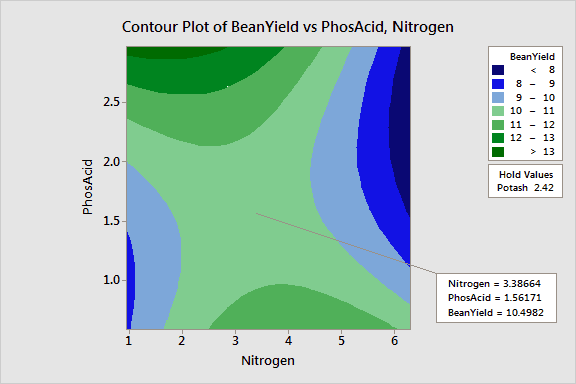
Suppose you have created a response surface contour plot of yield data from a recent soybean crop. You want to know the exact z-values of certain points.
Step 1: Create the graph
1 Open the worksheet CCD_EX1.MTW.
2 Choose Stat > DOE > Response Surface > Contour/Surface (Wireframe) Plots.
3 Check Contour plot and click Setup.
4 Click OK in each dialog box.
Step 2: Plant the flag
1 Choose Editor > Plant Flag.
2 Position the crosshairs on the point of interest in the data region. Click and drag the mouse to the location for the flag label to appear.
Graph window output
