main topic interpreting results session commands see also
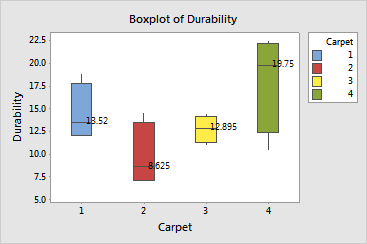
You want to assess the durability of four experimental carpet products. Samples of the carpet products are placed in four homes and you measure durability after 60 days. Create a boxplot with median labels and color-coded boxes to examine the distribution of durability for each carpet product.
1 Open the worksheet CARPET.MTW.
2 Choose Graph > Boxplot.
3 Under One Y, choose With Groups. Click OK.
4 In Graph variables, enter Durability.
5 In Categorical variables for grouping (1-4, outermost first), enter Carpet.
6 Click Labels, then click the Data Labels tab.
7 From Label, choose Medians. Choose Use y-value labels. Click OK.
8 Click Data View.
9 In Categorical variables for attribute assignment, enter Carpet. Click OK in each dialog box.
Graph window output

Median durability is highest for Carpet 4 (19.75). However, this product also demonstrates the greatest variability, with an interquartile range of 9.855. In addition, the distribution is negatively skewed, with at least one durability measurement of about 10.
Carpets 1 and 3 have similar median durabilities (13.52 and 12.895, respectively). Carpet 3 also exhibits the least variability, with an interquartile range of only 2.8925.
Median durability for Carpet 2 is only 8.625. This distribution and that of Carpet 1 are positively skewed, with interquartile ranges of about 5-6.
|
Tip |
To see precise information for Q1, median, Q3, interquartile range, whiskers, and N, hover your cursor over any part of the boxplot. |