main topic interpreting results session commands see also
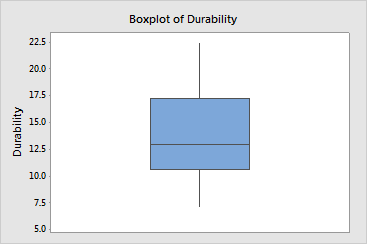
You want to examine the overall durability of your carpet products. Samples of the carpet products are placed in four homes and you measure durability after 60 days. Create a boxplot to examine the distribution of durability scores.
1 Open the worksheet CARPET.MTW.
2 Choose Graph > Boxplot.
3 Under One Y, choose Simple. Click OK.
4 In Variables, enter Durability. Click OK.
Graph window output

|
Tip |
To see precise information for Q1, median, Q3, interquartile range, whiskers, and N, hover your cursor over any part of the boxplot. |
The boxplot shows: