main topic
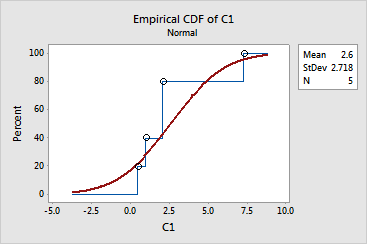
The empirical cdf (cumulative distribution function) plot below is for a sample with the following values: 0.5, 1.0, 2.1, 2.1, and 7.3.

Minitab first plots each value against the percentage of values in the sample that are less than or equal to it (circled in above illustration). Identical values are plotted only once. The points are then connected with a stepped line (blue). In the plot above:
Minitab also displays parameter estimates (or historical parameters, if you provide them) and the fitted cdf (cumulative distribution function; red line in above illustration). For the normal distribution, the mean and standard deviation are estimated from the data. For the lognormal distribution, the mean and standard deviation of the log of the data serve as the location and scale estimates, respectively. For other distributions, Minitab reports maximum likelihood estimates.
|
Tip |
If you hover your mouse over one of the plotted points, Minitab displays the row number and x- and y-values for the point. If you hover over the fitted line, Minitab displays the estimated percentiles for multiple points. |