main topic interpreting results session commands see also
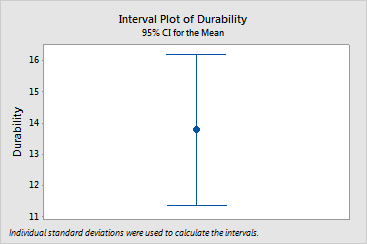
You want to examine the overall durability of your carpet products for advertising purposes. Samples of the carpet products are placed in four homes and you measure durability after 60 days. Create an interval plot to examine the mean durability.
1 Open the worksheet CARPET.MTW.
2 Choose Graph > Interval Plot or Stat > ANOVA > Interval Plot.
3 Under One Y, choose Simple. Click OK.
4 In Graph variables, enter Durability. Click OK.
Graph window output

To see the mean, hover your cursor over the mean symbol. Mean durability is 13.785. To see confidence interval information (estimate, interval, and N), hover your cursor over the interval bar. The 95% confidence interval extends from 11.3632 to 16.2068.