main topic interpreting results session commands see also
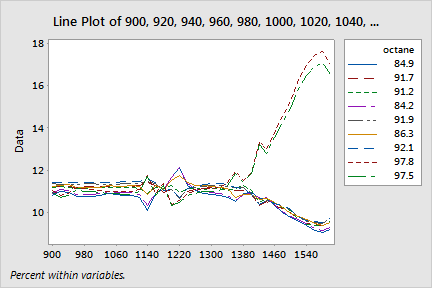
Your lab would like to compare chromatogram profiles for gasoline at various octanes for component consistency. An irregular profile could point out quality problems. You want to standardize Y values within components to accentuate difference among profiles.
1 Open the worksheet OCTANE.MTW.
2 Choose Graphs > Line Plot > Without Symbols, Series in Rows or Columns > OK.
3 In Graph variables, enter '900'-'1600'.
4 In Label column, enter 'Octane'.
5 Under Series Arrangement, choose Each row forms a series.
6 Click Plot Options.
7 Check Show Y as Percent.
8 Click OK in each dialog box.
Graph window output

The similar chromatogram profiles suggest consistency among components 900-1340. Octane formulations 97.8 and 97.5 have different profiles than the other formulations for components 1360-1600. Compared to the unadjusted profiles, the differences now stand out.
|
Note |
You can use tooltips to easily identify which profiles are different. |