main topic interpreting results session command see also
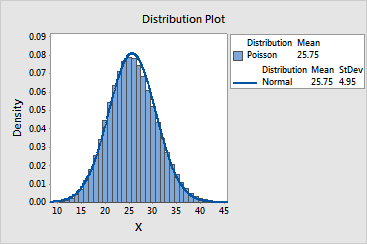
Suppose you are analyzing the number of customer service calls per day at a calling center. A Poisson distribution with a mean of 25.75 fits the distribution of calls. However, you would also like to see how well the normal distribution approximates the Poisson distribution using the parameter estimates from your sample. Use Probability Distribution Plot to compare the two distributions.
1 Choose Graph > Probability Distribution Plot.
2 Choose Two Distributions, then click OK.
3 From Distribution 1, choose Poisson.
4 In Mean, type 25.75.
5 From Distribution 2, choose Normal.
6 In Mean, type 25.75.
7 In Standard Deviation, type 4.95.
8 Click OK.
Graph window output

The normal distribution appears to closely, but not perfectly, approximate the Poisson distribution. The approximation should be close enough for most purposes.