main topic interpreting results session command see also
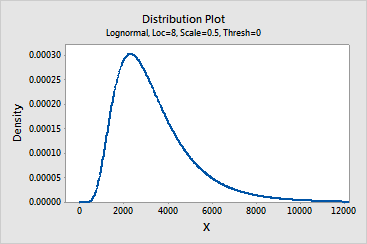
Suppose you are analyzing the distribution of operational hours for a machine part. Previous company research suggests that a lognormal distribution with a location of 8, scale of 0.5, and a threshold of 0 models the data well. To visualize this distribution, you use Probability Distribution Plot.
1 Choose Graph > Probability Distribution Plot.
2 Choose View Single, then click OK.
3 From Distribution, choose Lognormal.
4 In Location, type 8.
5 In Scale, type 0.5.
6 Click OK.
Graph window output

The distribution curve helps you visualize a lognormal distribution with the specified parameters. For the machine part, life span probability appears to peak at approximately 2300 hours. However, most parts will last longer than 2300 hours with a few lasting many times that. It is highly unlikely that a part will last less than 400 hours.
| Minitab help | Stat | Graph | SixSigma | DOE | Glossary | Reliability | SPC,MSA,CPK | ||
|
|||||||||