main topic interpreting results session command see also
Suppose you work for a company that manufactures tires. You are interested in finding out how many miles it takes for various proportions of the tires to "fail," or wear down to 2/32 of an inch of tread. You are especially interested in knowing how many of the tires last past 45,000 miles.
You inspect each tire at regular intervals (every 10,000 miles) to see if the tire has failed, then enter the data into the Minitab worksheet.
1 Open the worksheet TIREWEAR.MTW.
2 Choose Stat > Reliability/Survival > Distribution Analysis (Arbitrary Censoring) > Parametric Distribution Analysis
3 In Start variables, enter Start. In End variables, enter End.
4 In Frequency columns, enter Freq.
5 From Assumed distribution, choose Smallest extreme value.
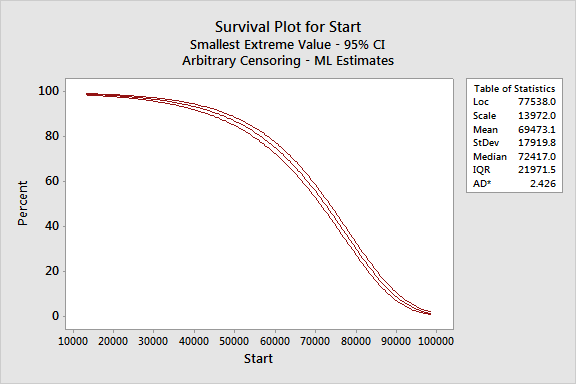
6 Click Graphs. Check Survival plot, then click OK.
7 Click Estimate. In Estimate probabilities for these times (values), enter 45000. Click OK in each dialog box.
Session window output
Distribution Analysis, Start = Start and End = End
Variable Start: Start End: End Frequency: Freq
Censoring Information Count Right censored value 71 Interval censored value 694 Left censored value 8
Estimation Method: Maximum Likelihood
Distribution: Smallest Extreme Value
Parameter Estimates
Standard 95.0% Normal CI Parameter Estimate Error Lower Upper Location 77538.0 547.040 76465.8 78610.2 Scale 13972.0 445.019 13126.5 14872.1
Log-Likelihood = -1465.913
Goodness-of-Fit Anderson-Darling (adjusted) = 2.426
Characteristics of Distribution
Standard 95.0% Normal CI Estimate Error Lower Upper Mean(MTTF) 69473.1 646.639 68205.7 70740.5 Standard Deviation 17919.8 570.759 16835.4 19074.1 Median 72417.0 599.541 71242.0 73592.1 First Quartile(Q1) 60130.2 849.036 58466.2 61794.3 Third Quartile(Q3) 82101.7 538.928 81045.4 83158.0 Interquartile Range(IQR) 21971.5 699.808 20641.8 23386.8
Table of Percentiles
Standard 95.0% Normal CI Percent Percentile Error Lower Upper 1 13264.5 2216.24 8920.79 17608.3 2 23020.0 1916.28 19264.1 26775.8 3 28756.5 1741.64 25342.9 32170.0 4 32848.0 1618.18 29676.4 36019.5 5 36038.3 1522.71 33053.9 39022.8 6 38658.9 1444.90 35827.0 41490.9 7 40886.6 1379.29 38183.3 43590.0 8 42826.9 1322.59 40234.6 45419.1 9 44547.8 1272.70 42053.3 47042.2 10 46095.8 1228.18 43688.6 48503.0 20 56580.8 939.304 54739.8 58421.8 30 63133.8 777.321 61610.3 64657.3 40 68152.6 670.956 66837.5 69467.6 50 72417.0 599.541 71242.0 73592.1 60 76316.5 555.679 75227.4 77405.6 70 80131.6 537.646 79077.8 81185.3 80 84187.1 548.165 83112.7 85261.4 90 89191.1 600.473 88014.2 90368.0 91 89816.2 609.626 88621.4 91011.1 92 90483.5 619.952 89268.4 91698.6 93 91203.3 631.705 89965.2 92441.4 94 91990.6 645.247 90725.9 93255.3 95 92867.9 661.132 91572.1 94163.7 96 93871.7 680.261 92538.4 95205.0 97 95067.8 704.270 93687.4 96448.1 98 96596.6 736.691 95152.7 98040.5 99 98875.8 788.141 97331.0 100421
Table of Survival Probabilities
95.0% Normal CI Time Probability Lower Upper 45000 0.907181 0.890261 0.921608 |
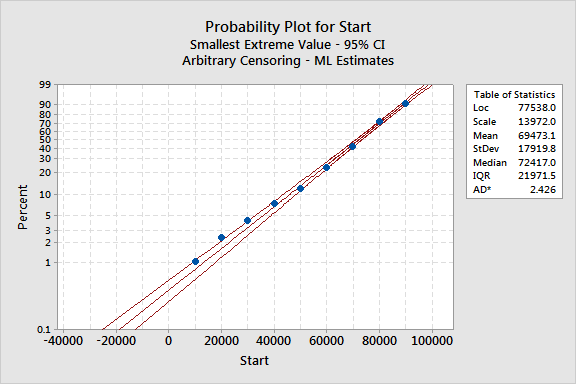
Graph window output


As shown in the Characteristics of Distribution table, the mean and median miles until the tires fail are 69,473.1 and 72,417.0 miles, respectively.
To see the times at which various percentages or proportions of the tires fail, look at the Table of Percentiles. For example, 5% of the tires fail by 36,038.3 miles and 50% fail by 72,417.0 miles.
In the Table of Survival Probabilities, you can see that 90.72% of the tires last past 45,000 miles.