main topics
A plot of events (failures and retirements) for all systems. The plot consists of:
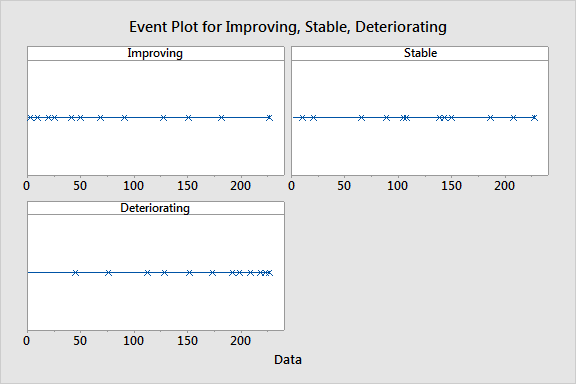
Use the event plot to visually determine whether successive failures are increasing, decreasing, or remaining constant.
Below are examples of event plots for improving, stable, and deteriorating systems.

|
Note |
For interval data, the event plot is constructed using the midpoint of each interval. |