main topics interpreting results session command see also
You work for an appliance manufacturer and must use current warranty data to predict the number of refrigerator compressor warranty claims you expect to see over the next five months.
1 Open the worksheet COMPRESSOR.MTW.
2 Choose Stat > Reliability/Survival > Warranty Analysis > Pre-Process Warranty Data.
3 In Shipment (sale) column, enter Ship.
4 In Return (failure) columns, enter Month1-Month12. Click OK.
5 Choose Stat > Reliability/Survival > Warranty Analysis > Warranty Prediction.
6 In Start time, enter 'Start time'. In End time, enter 'End time'. In Frequency (optional), enter Frequencies.
7 Click Prediction. In Production quantity for each time period, enter 1000. Click OK in each dialog box.
Session window output
Pre-Process Warranty Data: Shipment = Ship, Returns = Month1, Month2, ...
Warranty Prediction: Start = Start time and End = End time
* NOTE * 22 cases were used; 2 cases contained missing values or zero frequencies.
Using frequencies in Frequencies
Distribution: Weibull with shape = 1.26494, scale = 398.062 Estimation method: Maximum likelihood
Summary of Current Warranty Claims
Total number of units 12000 Observed number of failures 69 Expected number of failures 68.5201 95% Poisson CI (53.2630, 86.7876)
Number of units at risk for future time periods 11931
Production Schedule
Future time period 1 2 3 4 5 Production quantity 1000 1000 1000 1000 1000
Table of Predicted Number of Failures
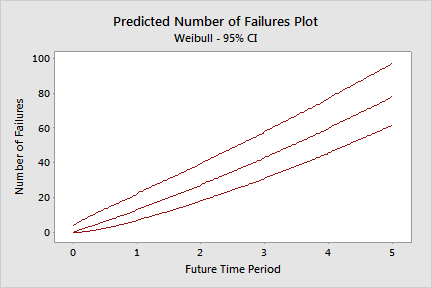
Future Potential Predicted Time Number of Number of 95% Poisson CI Period Failures Failures Lower Upper 1 12931 13.1073 7.0000 22.3660 2 13931 27.4930 18.1933 39.8678 3 14931 43.1798 31.2722 58.1271 4 15931 60.1892 45.9516 77.4449 5 16931 78.5416 62.1373 97.9488 |
Graph window output

You can see from the summary of current warranty claims that, of 12000 units in the field during the data collection period, 69 compressors failed. Using the Weibull distribution to model time-to-failure, approximately 69 units were expected to fail.
From the table of predicted number of failures and the predicted number of failures plot, you can conclude with 95% confidence that between approximately 62 and 98 more units are expected to fail in the next five months.