main topic interpreting results session command see also
Measurements were made on nine widgets. You know that the distribution of measurements has historically been close to normal with s = 0.2. Because you know s, and you wish to test if the population mean is 5 and obtain a 90% confidence interval for the mean, you use the Z-procedure.
1 Open the worksheet EXH_STAT.MTW.
2 Choose Stat > Basic Statistics > 1-Sample Z.
3 In One or more samples, each in a column, enter Values.
4 In Known standard deviation, enter 0.2.
5 Check Perform hypothesis test. In Hypothesized mean, enter 5.
6 Click Options. In Confidence level, enter 90. Click OK.
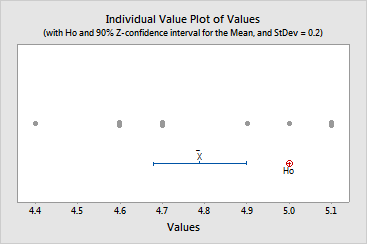
7 Click Graphs. Check Individual value plot. Click OK in each dialog box.
Session window output
One-Sample Z: Values
Test of μ = 5 vs ≠ 5 The assumed standard deviation = 0.2
Variable N Mean StDev SE Mean 90% CI Z P Values 9 4.7889 0.2472 0.0667 (4.6792, 4.8985) -3.17 0.002 |
Graph window output

The test statistic, Z, for testing if the population mean equals 5 is -3.17. The p-value, or the probability of rejecting the null hypothesis when it is true, is 0.002. This is called the attained significance level, p-value, or attained a of the test. Because the p-value of 0.002 is smaller than commonly chosen a-levels, there is significant evidence that m is not equal to 5, so you can reject H0 in favor of m not being 5.
A hypothesis test at a = 0.1 could also be performed by viewing the individual value plot. The hypothesized value falls outside the 90% confidence interval for the population mean (4.6792, 4.8985), and so you can reject the null hypothesis.