main topic interpreting results session command see also
A study was performed in order to evaluate the effectiveness of two devices for improving the efficiency of gas home-heating systems. Energy consumption in houses was measured after one of the two devices was installed. The two devices were an electric vent damper (Damper = 1) and a thermally activated vent damper (Damper = 2). You want to determine whether the variability in energy consumption is greater for one device than for the other.
The energy consumption data are stacked in one column (BTU.In). A separate column (Damper) identifies which sample each row belongs to.
1 Open the worksheet FURNACE.MTW.
2 Choose Stat > Basic Statistics > 2 Variances.
3 Choose Both samples are in one column.
4 In Samples, enter 'BTU.In'.
5 In Sample IDs, enter Damper.
6 Click OK.
Session window output
Test and CI for Two Variances: BTU.In vs Damper
Method
Null hypothesis σ(1) / σ(2) = 1 Alternative hypothesis σ(1) / σ(2) ≠ 1 Significance level α = 0.05
Statistics
95% CI for Damper N StDev Variance StDevs 1 40 3.020 9.120 (2.347, 4.085) 2 50 2.767 7.656 (2.335, 3.413)
Ratio of standard deviations = 1.091 Ratio of variances = 1.191
95% Confidence Intervals
CI for CI for StDev Variance Method Ratio Ratio Bonett (0.763, 1.494) (0.581, 2.232) Levene (0.697, 1.412) (0.486, 1.992)
Tests
Test Method DF1 DF2 Statistic P-Value Bonett — — — 0.586 Levene 1 88 0.00 0.996 |
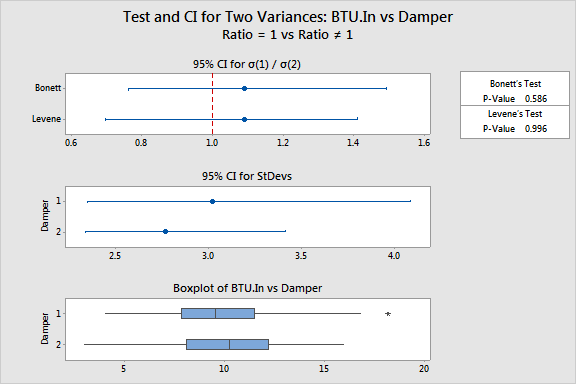
Graph window output

The method table displays the hypotheses being tested. Because you accepted the defaults, the null hypothesis states that the ratio of the two population standard deviations is 1 (they are equal) and the alternative is that the ratio is not equal to 1 (they are not equal). The test results are at the bottom of the output.
The statistics table displays the sample size and point estimates of the standard deviation and variance for each population. The statistics table also displays confidence intervals for the population standard deviations or the population variances.
Minitab calculates the 95% confidence intervals for the standard deviation and variance ratios. If these intervals contain 1, then there is not enough evidence to suggest that the standard deviations or the variances of the populations are not equal.
The results of Bonett's test and Levene's test are given at the bottom of the Session window. In general, you should base your conclusions on Bonett's method, unless you have small samples from very skewed, or heavy-tailed distributions. (See Tests of 2 Variances for further discussion.)
For the energy consumption example, because both p-values (0.586 and 0.996) are greater than reasonable choices of a, you fail to reject the null hypothesis that the standard deviations are equal. These data do not provide enough evidence to claim that the two populations have unequal standard deviations.