main topic
Creating a scatterplot (with Graph > Scatterplot) is a great way to evaluate whether there is a relationship between variables and what kind of relationship it might be. A linear relationship is only one possibility.
A linear relationship is a trend in the data that can be modeled by a straight line. For example, suppose an airline wants to estimate the impact of fuel prices on flight costs. They find that for every dollar increase in the price of a gallon of jet fuel, the cost of their LA-NYC flight increases by about $3500. This describes a linear relationship between jet fuel cost and flight cost.
|
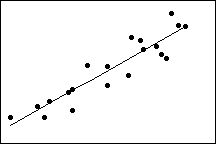
Plot 1: Strong positive linear relationship
|
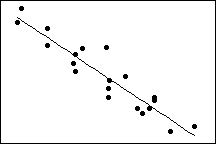
Plot 2: Strong negative linear relationship
|
When both variables increase or decrease concurrently, a positive linear relationship exists. The points in Plot 1 follow the line closely, suggesting that the relationship between the variables is strong. The Pearson correlation coefficient for this relationship is +0.921.
When one variable increases while the other variable decreases, a negative linear relationship exists. The points in Plot 2 follow the line closely, suggesting that the relationship between the variables is strong. The Pearson correlation coefficient for this relationship is -0.934.
|
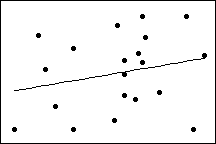
Plot 3: Weak linear relationship
|
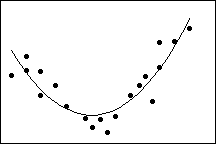
Plot 4: Nonlinear relationship
|
The data points in Plot 3 appear to be randomly distributed. They do not fall close to the line indicating a very weak relationship if one exists. The Pearson correlation coefficient for this relationship is +0.238.
Plot 4 shows a strong relationship between two variables. However, because the relationship is not linear, the Pearson correlation coefficient is only +0.244. This illustrates why It is important to plot the data in order to explore any relationships that might exist.
Plot 5: Monotonic relationship
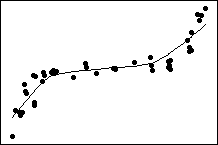
Plot 5 shows both variables increasing concurrently, but not at the same rate. This relationship is monotonic, but not linear. The Pearson correlation coefficient for these data is 0.843, but the Spearman correlation is higher, 0.948.
Linear relationships are also monotonic. For example the relationship shown in Plot 1 is both monotonic and linear.