main topic interpreting results session command see also
In an operating engine, parts of the crankshaft move up and down. AtoBDist is the distance (in mm) from the actual (A) position of a point on the crankshaft to a baseline (B) position. To ensure production quality, a manager took five measurements each working day in a car assembly plant, from September 28 through October 15, and then ten per day from the 18th through the 25th.
You wish to see if these data follow a normal distribution, so you use Normality test.
1 Open the worksheet CRANKSH.MTW.
2 Choose Stat > Basic Statistics > Normality Test.
3 In Variable, enter AtoBDist. Click OK.
Graph window output

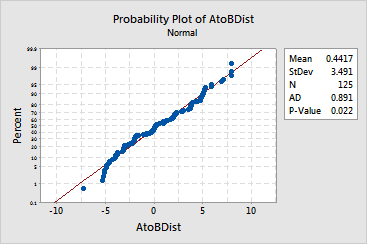
The graphical output is a plot of normal probabilities versus the data. The data depart from the fitted line most evidently in the extremes, or distribution tails. The Anderson-Darling test's p-value indicates that, at a levels greater than 0.022, there is evidence that the data do not follow a normal distribution. There is a slight tendency for these data to be lighter in the tails than a normal distribution because the smallest points are below the line and the largest point is just above the line. A distribution with heavy tails would show the opposite pattern at the extremes.