main topic
If a sample contains more than one suspected outlier, then Grubbs' test and Dixon's Q ratio may not be effective. The other Dixon's tests are designed to overcome the masking effect that multiple potential outliers can cause.
You should not use Minitab's outlier tests more than once on the same sample. If you remove an outlier from your sample and then retest, you risk removing values that are not actually outliers.
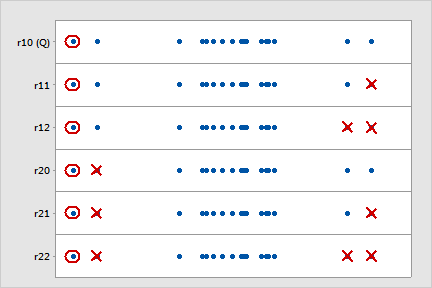
In the illustration below, each row shows how the different Dixon ratios (indicated on the left) treat the same sample. The circled value is the potential outlier. It is the farthest value from the median of the sample. The Xs in each row indicate which data values each Dixon ratio ignores when calculating the test statistic. (This illustration assumes that either Smallest or largest data value is an outlier or Smallest data value is an outlier is chosen as the alternative hypothesis.) For these data, Dixon's r22 ratio is the test that is most likely to identify the circled value as an outlier.

Dixon noted [11] that larger samples from a normal population are more likely to include extreme values. He proposed the following general guidelines for the different ratios:
|
Sample size (n) |
Recommended ratio |
|
3 <= n <= 7 |
r10 (also called Dixon's Q ratio) |
|
8 <= n <= 10 |
r11 |
|
11 <= n <= 13 |
r21 |
|
n >= 14 |
r22 |