main topic interpreting results session command see also
You receive data for the breaking strength of broom handles. You notice that one of the values in the sample seems unusually small. Before you analyze the data further, you use Outlier Test to determine whether the smallest value is an outlier.
1 Open the worksheet OUTLIER.MTW.
2 Choose Stat > Basic Statistics > Outlier Test.
3 In Variables, enter BreakStrength.
4 Click Options.
5 In What do you want to determine, choose Smallest data value is an outlier.
6 Click OK in each dialog box.
Session window output
Outlier Test: BreakStrength
Method
Null hypothesis All data values come from the same normal population Alternative hypothesis Smallest data value is an outlier Significance level α = 0.05
Grubbs' Test
Variable N Mean StDev Min Max G P BreakStrength 14 123.4 46.3 12.4 193.1 2.40 0.044
Outlier
Variable Row Outlier BreakStrength 10 12.38 |
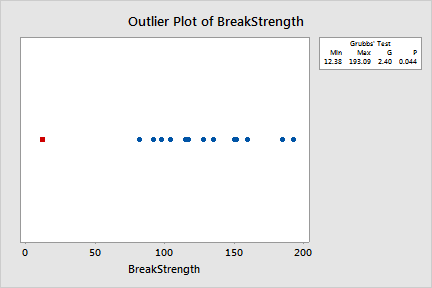
Graph window output

The results for the broom handle data show that the mean of the sample is 123.4. The G statistic indicates that the smallest data value, 12.38, is 2.4 standard deviations less than the mean. The p-value indicates that, if all values are truly from the same, normally distributed population, then the probability of obtaining a minimum value that small is only 0.044. This p-value is less than your chosen significance level, so you can reject the null hypothesis and conclude that the smallest value is an outlier.
You investigate further and discover that the person who entered the data accidentally entered 12.38 instead of 123.8.