main topic interpreting results session command see also
An insurance agent wants to use a U chart to monitor the number of accidents per month at a particular intersection. Because a U chart assumes that data follow a Poisson distribution, the agent wants to assess whether the number of accidents follow a Poisson distribution. The agent records the number of accidents per month at this intersection for 50 months.
1 Open the worksheet ACCIDENT.MTW.
2 Choose Stat > Basic Statistics > Goodness-of-Fit Test for Poisson.
3 In Variable, enter Accidents.
4 Click OK.
Session window output
Goodness-of-Fit Test for Poisson Distribution
Data column: Accidents
Poisson mean for Accidents = 2.24
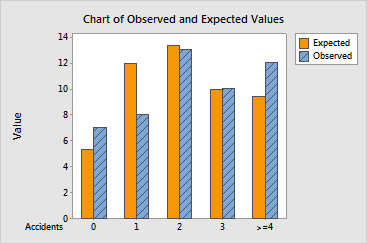
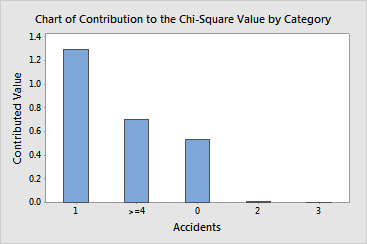
Poisson Contribution Accidents Observed Probability Expected to Chi-Sq 0 7 0.106459 5.3229 0.52839 1 8 0.238467 11.9234 1.29097 2 13 0.267083 13.3542 0.00939 3 10 0.199422 9.9711 0.00008 >=4 12 0.188569 9.4285 0.70136
N N* DF Chi-Sq P-Value 50 0 3 2.53020 0.470 |
Graph window output


Minitab calculates each category's contribution to the chi-square value as the square of the difference in the observed and expected values for a category divided by the expected value for that category. The largest difference between the observed and expected value is for the category with 1 accident and is the highest contributor to the chi-square statistic. However, the contribution is not enough to reject the null hypothesis. If you choose an a-level of 0.05, the p-value for this test is 0.470, which is greater than 0.05. Therefore, you can conclude that you do not have enough evidence to reject that the number of accidents at a particular intersection follow a Poisson distribution.
|
Note |
The chi-square test is an approximate test and the test result may not be valid when the expected value for a category is less than 5. If one or more categories have expected values less than 5, you can combine them with adjacent categories to achieve the minimum required expected value. |