main topic interpreting results session command see also
You want to determine whether your generic antacid is equivalent to a name-brand antacid. Two groups of participants receive a 5-day course of one antacid, followed by a 2-week washout period, and then a 5-day course of the other antacid. You measure gastric pH on the last day of each treatment. Because lower pH values are more acidic, higher values mean the drug is more effective. You will consider the antacids equivalent if the test pH is within 10% of the reference pH.
Group 1 receives the generic antacid (the test treatment) followed by the name-brand antacid (the reference treatment). Group 2 receives the name-brand antacid followed by the generic antacid.
1 Open the worksheet STOMACHACID.MTW.
2 Choose Stat > Equivalence Tests > 2x2 Crossover Design.
3 Choose Data for two sequences are unstacked.
4 From Treatment order for sequence 1, choose Test, Reference.
5 In Sequence 1, Period 1, enter 'Group 1, Generic'. In Sequence 1, Period 2, enter 'Group 1, Brand'.
6 In Sequence 2, Period 1, enter 'Group 2, Brand'. In Sequence 2, Period 2, enter 'Group 2, Generic'.
7 From Hypothesis about, choose Test mean - reference mean.
8 From What do you want to determine, choose Lower limit < test mean - reference mean < upper limit.
9 In Lower limit, enter -0.1. In Upper limit, enter 0.1.
10 Check Multiply by reference mean.
11 Click Options.
12 In Label for reference treatment, type Brand, and in Label for test treatment, type Generic.
13 Click OK in each dialog box.
Session window output
Equivalence Test for 2x2 Crossover Design: Group 1, Generic, Group 1, Brand, Group 2, Brand,
Method
Treatment order for subjects in sequence 1: Generic, Brand Treatment order for subjects in sequence 2: Brand, Generic Lower equivalence limit = -0.1 × sample reference mean = -0.42503 Upper equivalence limit = 0.1 × sample reference mean = 0.42503
Descriptive Statistics
Period 1 Period 2 Sequence N Mean StDev Mean StDev 1 9 4.0911 0.68641 4.3144 0.63677 2 8 4.1862 0.74110 3.7675 0.65741
Within-subject standard deviation = 0.08825
Effects
Effect SE DF T-Value P-Value 95% CI Carryover 0.45181 0.64988 15 0.69521 0.498 (-0.93339, 1.8370) Treatment -0.32104 0.060641 15 -5.2941 0.000 (-0.45030, -0.19179) Period -0.097708 0.060641 15 -1.6112 0.128 (-0.22696, 0.031546)
Difference: Mean(Generic) - Mean(Brand)
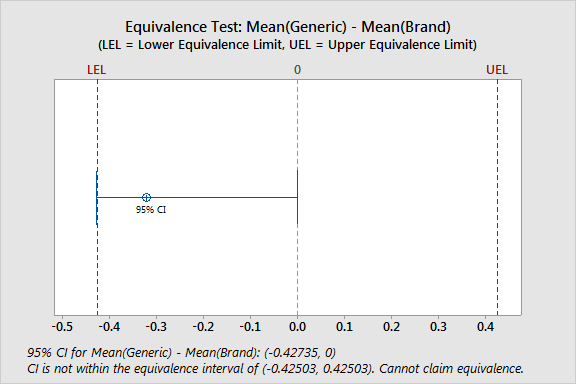
Difference SE 95% CI Equivalence Interval -0.32104 0.060641 (-0.42735, 0) (-0.42503, 0.42503)
CI is not within the equivalence interval. Cannot claim equivalence.
Test
Null hypothesis: Difference ≤ -0.42503 or Difference ≥ 0.42503 Alternative hypothesis: -0.42503 < Difference < 0.42503 α level: 0.05
Null Hypothesis DF T-Value P-Value Difference ≤ -0.42503 15 1.7149 0.053 Difference ≥ 0.42503 15 -12.303 0.000
The greater of the two P-Values is 0.053. Cannot claim equivalence. |
Graph window output

|
Note |
You should not evaluate equivalence if either the carryover effect or the period effect is significant. If either effect is significant, then the equivalence results may be unreliable. |
The p-value for the carryover effect (0.498) and the p-value for the period effect (0.128) are both greater than 0.05. Thus these effects are not significant at the 0.05 level.
The p-value for the treatment effect (0.000) is less than 0.05. Thus the treatment effect is significant at the 0.05 level. The significant treatment effect indicates that one antacid is better than the other at raising stomach pH. The generic antacid did not raise stomach pH as much as the brand-name antacid. The mean stomach pH after the generic antacid was approximately -0.321 less than the average pH after the brand-name antacid.
The difference table and the equivalence plot show that the confidence interval for the difference (-0.42735, 0) falls partly outside of the equivalence interval (-0.42503, 0.42503). Thus you cannot claim that the two antacids are equally effective at raising stomach pH.
The test table confirms that you cannot claim significance. The highest p-value is 0.053, which is greater than the a level of 0.05. Thus you cannot conclude that the two antacids are equally effective at raising stomach pH.