main topic interpreting results session command see also
You developed a new cleaning solution for contact lenses. You want to verify that your new solution cleans lenses as well as the leading brand. You have 14 participants wear contact lenses for a day, and then clean the lenses. Each participant cleans one lens in your solution and the other lens in the leading brand. By pairing the observations, you reduce the amount of variability that is caused by differences between participants. Finally, you assess the cleanliness of each lens by measuring the angle of contact for a drop of fluid on the lens. The angle of contact is affected by film or deposits on the lens.
1 Open the worksheet CONTACTLENS.MTW.
2 Choose Stat > Equivalence Tests > Paired.
3 In Test sample, enter New.
4 In Reference sample, enter 'Leading Brand'.
5 From Hypothesis about, choose Test mean - reference mean.
6 From What do you want to determine, choose Lower limit < test mean - reference mean < upper limit.
7 In Lower limit, enter -0.5 and in Upper limit, enter 0.5.
8 Click OK.
Session window output
Equivalence Test with Paired Data: New, Leading Brand
Method
Test mean = mean of New Reference mean = mean of Leading Brand
Descriptive Statistics
Variable N Mean StDev SE Mean New 14 88.604 1.5578 0.41634 Leading Brand 14 88.724 1.5907 0.42514
Difference: Mean(New) - Mean(Leading Brand)
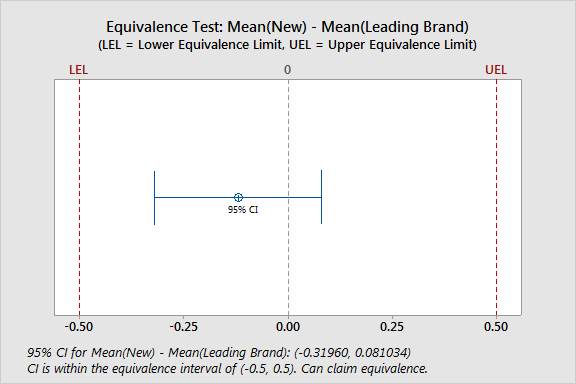
Difference StDev SE 95% CI Equivalence Interval -0.11929 0.42324 0.11312 (-0.31960, 0.081034) (-0.5, 0.5)
CI is within the equivalence interval. Can claim equivalence.
Test
Null hypothesis: Difference ≤ -0.5 or Difference ≥ 0.5 Alternative hypothesis: -0.5 < Difference < 0.5 α level: 0.05
Null Hypothesis DF T-Value P-Value Difference ≤ -0.5 13 3.3657 0.003 Difference ≥ 0.5 13 -5.4748 0.000
The greater of the two P-Values is 0.003. Can claim equivalence. |
Graph window output

For the contact lens data, the confidence interval for the difference is completely within the equivalence interval. Thus you can conclude that both cleaning solutions are equally effective at cleaning contact lenses.