main topic interpreting results session command see also
You conduct a study to determine the long-term effect of a change in environment on blood pressure. The subjects are 39 Peruvian males over 21 years of age who had migrated from the Andes mountains to larger towns at lower elevations. You recorded their age (Age), years since migration (Years), weight in kg (Weight), height in mm (Height), skin fold of the chin, forearm, and calf in mm (Chin, Forearm, Calf), pulse rate in beats per minute (Pulse), and systolic and diastolic blood pressure (Systol, Diastol).
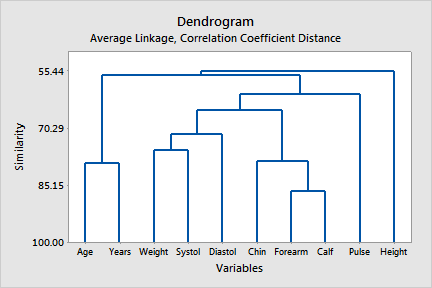
Your goal is to reduce the number of variables by combining variables with similar characteristics. You use clustering of variables with the default correlation distance measure, average linkage and a dendrogram.
1 Open the worksheet PERU.MTW.
2 Choose Stat > Multivariate > Cluster Variables.
3 In Variables or distance matrix, enter Age-Diastol.
4 For Linkage Method, choose Average.
5 Check Show dendrogram. Click OK.
Session window output
Cluster Analysis of Variables: Age, Years, Weight, Height, Chin, Forearm, Calf, Pulse, ...
Correlation Coefficient Distance, Average Linkage Amalgamation Steps
Number of obs. Number of Similarity Distance Clusters New in new Step clusters level level joined cluster cluster 1 9 86.7763 0.264474 6 7 6 2 2 8 79.4106 0.411787 1 2 1 2 3 7 78.8470 0.423059 5 6 5 3 4 6 76.0682 0.478636 3 9 3 2 5 5 71.7422 0.565156 3 10 3 3 6 4 65.5459 0.689082 3 5 3 6 7 3 61.3391 0.773218 3 8 3 7 8 2 56.5958 0.868085 1 3 1 9 9 1 55.4390 0.891221 1 4 1 10 |
Graph window output

Minitab displays the amalgamation steps in the Session window. At each step, two clusters are joined. The table shows which clusters were joined, the distance between them, the corresponding similarity level, the identification number of the new cluster (this is always the smaller of the two numbers of the clusters joined), the number of variables in the new cluster and the number of clusters. Amalgamation continues until there is just one cluster.
If you had requested a final partition you would also receive a list of which variables are in each cluster.
The dendrogram displays the information printed in the amalgamation table in the form of a tree diagram. Dendrogram suggest variables which might be combined, perhaps by averaging or totaling. In this example, the chin, forearm, and calf skin fold measurements are similar and you decide to combine those. The age and year since migration variables are similar, but you will investigate this relationship. If subjects tend to migrate at a certain age, then these variables could contain similar information and be combined. Weight and the two blood pressure measurements are similar. You decide to keep weight as a separate variable but you will combine the blood pressure measurements into one.