main topic interpreting results session command see also
A bank is interested in surveying customers to determine how satisfied they are with the timeliness of its service. You develop the following four survey questions:
Item 1 - My telephone, email, or letter inquiry was answered in a reasonable amount of time.
Item 2 - I am satisfied with the timeliness of the service provided.
Item 3 - The time I waited for services was reasonable.
Item 4 - I am satisfied with the services I received.
Each of the questions are answered on a 5-point Likert scale: 1 = Very dissatisfied, 2 = Dissatisfied, 3 = Neutral, 4 = Satisfied, and 5 = Very satisfied. Before you distribute the survey, you want to test the questions to ensure they consistently measure customer service timeliness. 60 customers are requested to answer these four questions.
1 Open the worksheet CRONBACH.MTW.
2 Choose Stat > Multivariate > Item Analysis.
3 In Variables, enter Item 1 - Item 4.
4 Click Graphs and check Matrix plot of data with smoother.
6 Click OK in each dialog box.
Session window output
Item Analysis of Item 1, Item 2, Item 3, Item 4
Correlation Matrix
Item 1 Item 2 Item 3 Item 2 0.814 Item 3 0.795 0.789 Item 4 0.038 0.017 -0.003
Cell Contents: Pearson correlation
Item and Total Statistics
Total Variable Count Mean StDev Item 1 60 3.450 1.333 Item 2 60 3.383 1.415 Item 3 60 3.317 1.255 Item 4 60 2.167 0.827 Total 60 12.317 3.833
Cronbach’s alpha = 0.7853
Omitted Item Statistics
Adj. Squared Omitted Adj. Total Total Item-Adj. Multiple Cronbach’s Variable Mean StDev Total Corr Corr Alpha Item 1 8.867 2.665 0.818768 0.725307 0.599499 Item 2 8.933 2.603 0.802999 0.717877 0.606279 Item 3 9.000 2.768 0.785333 0.691912 0.625996 Item 4 10.150 3.727 0.019250 0.004488 0.921674 |
Graph window output

The overall Cronbach's alpha is 0.7853, which is higher than a commonly used benchmark value of 0.7. This suggests that at least some of the items measure the same construct of customer service timeliness.
|
Caution |
Benchmarks usually depend on the standards in your subject area and the number of items. |
To assess whether all items measure the same construct, evaluate the inter-item correlations and omitted item statistics.
Use the correlation matrix to evaluate whether two items are correlated. Because you want all items to measure the same construct, customer service timeliness, you need them to be highly correlated. The closer the values are to 1 the more highly correlated the items are. Negative correlations are theoretically possible but, in practice, they generally are not seen in item analysis.
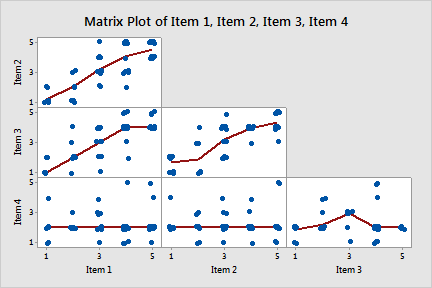
In this example, items 1, 2, and 3 are highly correlated with values ranging around 0.8. Item 4 is not correlated with the other items because the correlation values range around 0.
Further, the Matrix Plot graphically shows that items 1, 2 and 3 have a positive relationship while item 4 has no relationship with other items in the construct.
In this example, item 4 has a low Item-Adj. Total Corr (0.019250), a low Squared Multiple Correlation (0.004488), and removing it from the construct increases Cronbach's alpha from 0.7853 to 0.921674.
Collectively, the results suggest that only items 1, 2, and 3 measure customer service timeliness. The manager should either remove item 4 or reword and retest to make sure the items are measuring the same construct.