main topic interpreting results session command see also
Solar energy studies indicate that the important factors for total heat flux (HeatFlux) from homes are the position of the focal points in the east, south, and north directions. Additionally, these focal points are significant predictors for the amount of solar radiation that the focal points receive (Insolation).
Your goal is to optimize both responses: HeatFlux and Insolation. You want to arrange the focal points to receive a sufficient amount of solar radiation but not to generate excessive heat.
You do not need to analyze these regression models. The worksheet contains the models for the response optimizer.
1 Open the worksheet FLUXINSOLATION.MTW.
2 Choose Stat > Regression > Regression > Response Optimizer.
3 For Insolation, choose Target and enter 750.
4 For HeatFlux, choose Target and enter 200.
5 Click OK in each dialog box.
Session Window Output
Response Optimization: Insolation, HeatFlux
Parameters
Response Goal Lower Target Upper Weight Importance Insolation Target 568.55 750 909.45 1 1 HeatFlux Target 181.50 200 278.70 1 1
Solution
Insolation HeatFlux Composite Solution East South North Fit Fit Desirability 1 31.9438 31.84 17.6683 750 200 1
Multiple Response Prediction
Variable Setting East 31.9438 South 31.84 North 17.6683
Response Fit SE Fit 95% CI 95% PI Insolation 750.0 47.3 ( 652.7, 847.3) ( 591.3, 908.7) HeatFlux 200.00 6.68 (186.25, 213.75) (177.58, 222.42) |
Graph Window Output

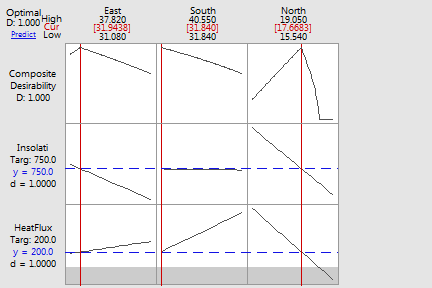
The combined or composite desirability of these two responses is 1, which indicates an excellent solution.
To obtain this desirability, you would set the factor levels at the values shown under Multiple Response Prediction. That is, East would be set at 31.9438, South at 31.84, and North at 17.6683. The predicted responses for these settings are 750.0 for Insolation and 200.00 for HeatFlux. The confidence intervals and prediction intervals indicate the precision of these predictions.
If you want to adjust the factor settings of this initial solution, you can use the plot. Move the vertical bars to change the factor settings and see how the individual desirability (d) of the responses and the composite desirability change.
The response optimizer uses model equations. Ensure that your models are adequate before you interpret the results.