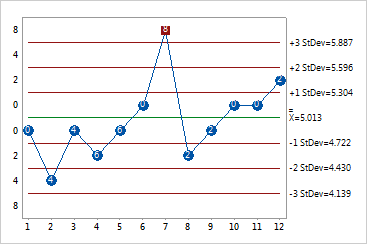

Plots a cumulative score, based on "zones" at 1, 2, and 3 standard deviations from the center line. A hybrid between an Xbar (or individuals) control chart and a CUSUM control chart. A point is out of control simply, by default, if its score is greater than or equal to 8 (the zone 4 score). Use Zone charts when you have variables data and want to create an easily interpretable control chart. Zone charts are also known as J charts.
By default, the weights for each zone are:
Consider the Zone chart below. A manufacturer wants to assess the length of a part. The quality team samples 10 parts from each of 3 shifts for 4 days. Notice that the first subgroup has a score of 0 because this point falls in zone 1. Subgroup 2 has a zone score of 4 because it falls in zone 3. The zone scores are added for consecutive points that fall on either side of the center line. By default, the cumulative score is reset to zero when the next point appears on the opposite side of the center line; for example, see subgroup 6. Subgroup 7 has a zone score of 8, indicating that an out-of-control situation.
|
|