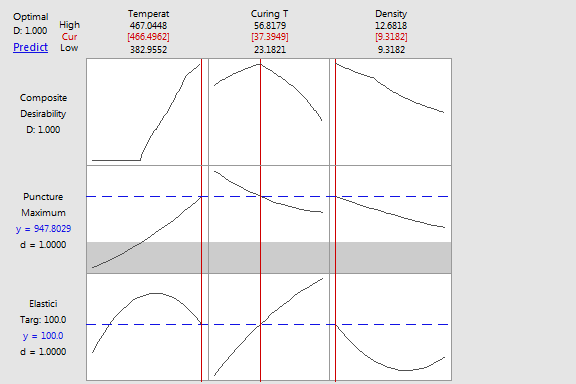
Look at the plot to see the variable settings that optimize the responses.
Response optimizer does not use the data in the worksheet. Instead,
Minitab estimates the optimal variable values based on stored models.
You must fit a model before you can use the response optimizer. If you
want to optimize multiple responses, you must fit a model for each response
separately. The optimal values are accurate only if all models represent
the true relationships.
Example Output |

|

Interpretation |

|
For the tire data:
· Temperature: Increases in temperature
moves elasticity closer to its target of 100.0,
and increases puncture resistance. Because the importance of puncture
resistance (2) is higher than elasticity (1), the overall desirability
benefits most from maximizing puncture resistance. However, because overall
desirability equals 1, the overall desirability cannot improve given the
limits set by this design.
· Curing Time: Increasing the curing time
moves elasticity closer to its target of 100.0,
but reduces puncture resistance. Because the importance of puncture resistance
(2) is higher than elasticity (1), the optimization settings maximize
puncture resistance while keeping elasticity as close to its target as
possible. It is not possible to improve on puncture resistance within
the limits set by this design.
· Density: Increasing density moves elasticity
farther from its target of 100.0 and decreases
puncture resistance, both of which are undesirable. If you could extrapolate
the plots to lower values of density, it appears that both elasticity
and puncture resistance could be increased simultaneously. This suggests
might be worthwhile to experiment with lower density.
For the tire data, the individual desirabilities for the tire data are
summarized below:
· Elasticity has an individual desirability
score of 1.0000
because the predicted response for elasticity of 100.0 is equal to the
target of 100.
· Puncture resistance has a perfect desirability
score of 1.0000
because the predicted response of 947.8029
exceeds the target of 924.882. The goal for puncture resistance was to
maximize; therefore higher values are more desirable.
The composite desirability of 1.0000
is a perfect score and indicates that both responses achieved their ideal
settings.
