|
|
Acceptance Sampling by Attributes - CompareGraphs - Average Outgoing Quality (AOQ) Curve |
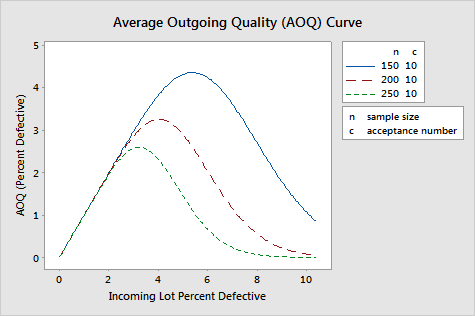
This plot allows you to see the average outgoing quality level at various incoming quality levels.
Example Output |

Interpretation |
|
For the grocery bags, the three curves representing the sampling plans with sample sizes of 150, 200, and 250 are located to the right of the original plan with a sample size of 306 bags. As the sample size decreases (curve moves to the right), the average outgoing quality decreases (the percent defective increases).
The worst outgoing quality level, the average outgoing quality limit (AOQL), also gets worse as the sample size decreases. With a sample of only 150 bags, the AOQL appears to be about 4.3% defective.