|
|
Capability Sixpack - Between/WithinGraphs - Capability Histogram |
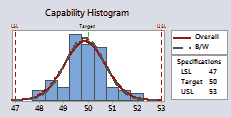
The Capability Histogram is located in the upper right corner of the Capability Sixpack - Between/Within.
Use the capability histogram to assess whether the data are normally distributed. The capability histogram consists of:
Assess the normality of the data by comparing the curve to the bars. A normal distribution is symmetric and bell-shaped. With small sample sizes, it can be difficult to assess normality with a histogram. The coating data appear approximately normal.
Examine the curves to see how closely they follow each other. A substantial difference between the B/W and overall curves may indicate that the process is out of control.
Example Output |

Interpretation |
For the piston data, the B/W and overall curves are approximately aligned. Therefore, the data appear to follow the normal curve.