|
|
Individual Distribution IdentificationGraphs - Distribution ID Plots: Exponential, 2-Parameter Exponential, Weibull, and 3-Parameter Weibull |
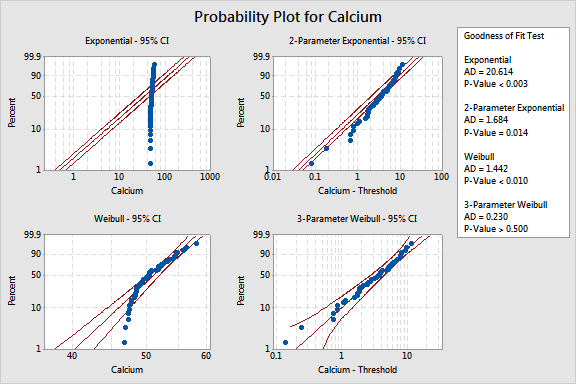
Use the probability plots to compare the fit of all distributions so you can choose the best-fitting distribution.
Example Output |

Interpretation |
The probability plot for the 3-parameter Weibull distribution shows that the points fall close to the middle line and within the confidence interval (AD = 0.230, P-Value > 0.500), suggesting that this distribution fits the calcium data well.
The probability plots, Anderson-Darling statistics, and p-values for the 2-parameter exponential, Weibull, and exponential distributions suggest that they do not fit the calcium data well.