|
|
Individual Distribution IdentificationGraphs - Distribution ID Plots: Logistic, Loglogistic, 3-Parameter Loglogistic, and Johnson Transformation |
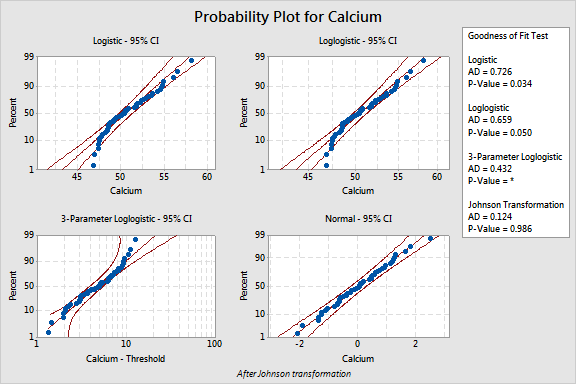
Use the probability plots to compare the fit of all distributions so you can choose the best-fitting distribution.
Example Output |

Interpretation |
The probability plots show that the points fall close to the middle line and within the confidence interval for the loglogistic distribution (AD = 0.659, P-Value = 0.050) and the Johnson Transformation (AD = 0.124, P-Value = 0.986), suggesting that these distributions fit the calcium data well.
For the 3-parameter loglogistic distribution, there is no established method for calculating the p-value. In these cases, it is advisable to first examine the p-value for the corresponding two-parameter distribution (0.050) which marginally indicates a good fit. Then look at the LRT P for the 3-parameter loglogistic distribution (from the goodness-of-fit tests, 0.027) which indicates that the three-parameter distribution is significantly better than the two-parameter distribution. Additionally, a visual inspection of the probability plot combined with the AD value (0.432) suggests that this distribution is a good fit. However, it may be advisable to choose a distribution which has a calculated p-value and a similar AD value.
The probability plot, Anderson-Darling statistic, and p-value for the logistic distribution suggest that this distribution does not fit the calcium data well.