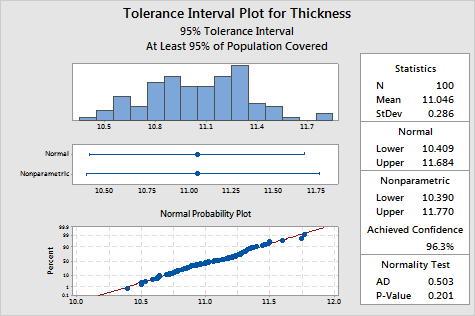
Tolerance interval
plots contain the following:
· A
histogram to visualize the distribution of your sample data. Look at the
central tendency,
variation,
and overall shape of the distribution. A histogram can help you confirm
assumptions and guide further analysis.
· Interval
plots to visualize the sample mean along with the upper and/or lower bounds
of the tolerance intervals. A vertical line at the end of the interval
represents a bound while an arrow indicates there is no bound for that
side of the interval.
Minitab uses an exact method to calculate the normal tolerance
intervals.
· A
normal probability plot to help you determine whether your data follow
a normal distribution. If your data are perfectly normal, then the data
points on the probability plot form a straight line.
· A
table displaying the mean, standard deviation, the normal and nonparametric
method tolerance intervals, and Anderson-Darling normality test values.
The normality test evaluates the null hypothesis (H0)
that the data follow a normal distribution. If the p-value
for the test is less than your chosen a-level,
then you must reject H0 and conclude that your data
do not follow a normal distribution.
· For
the nonparametric method, Minitab calculates the achieved confidence level.
This is the exact confidence level obtained from your sample. It will
generally be greater than or equal to your desired confidence level, unless
your sample size is too small.
Example Output |

|

Interpretation |

|
The normal probability plot shows that the points fall reasonably close
to the reference line, which indicates that the data follow a normal distribution.
The p-value for the Anderson-Darling normality test (bottom right) of
the washer data is 0.201. This value is greater
than the chosen a-level of 0.05. Thus, there
is not enough evidence to suggest that the data do not follow a normal
distribution. Use the normal method results.
The manufacturer is interested in the range that most washer thicknesses
will fall in. The tolerance intervals contain this information. Because
the data are normally distributed, the manufacturer is 95% confident that
at least 95% of all washers produced will have thicknesses falling in
the normal method interval [10.409
11.684].
The analyst compares this tolerance interval to a major client's washer
specs [10 12]. Because the tolerance interval is contained within the
client's requirements, the analyst concludes that current thickness variability
is not excessive.