
Orthogonal Regression
Graphs - Residuals versus the Variables
![]()
![]()
![]()
|
|
Orthogonal RegressionGraphs - Residuals versus the Variables |
|
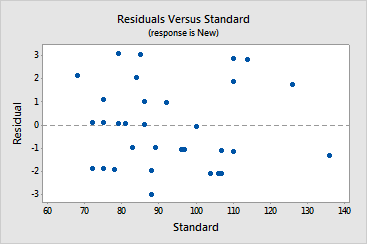
This graph plots the residuals versus another variable. The residuals should fluctuate in a random pattern around the center line. Use the plot to look for nonlinearity or differences in the magnitude of the residuals.
Example Output |
|
Interpretation |
|
The researchers wanted to plot the residuals versus the predictor Standard. The pattern of residuals is random, indicating the residuals are linear and the magnitude of the residuals is consistent across the values of Standard.