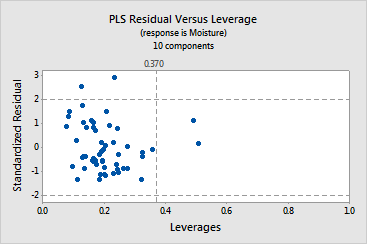
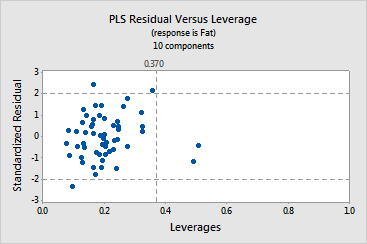
The residual versus leverage plot is a scatterplot of the standardized residuals
versus the leverage
of each observation. When examining this plot, look for:
· Outliers
- Observations with standardized residuals greater
than +/- 2, which lie outside the horizontal reference lines on the plot.
· Leverage
points - Observations with leverage values
greater than 2m / n, where m = the number of components and n = the number
of observations, which are considered extreme. They have x-scores far
from zero and are to the right of the vertical reference line, which is
located at the value 2m / n on the x-axis. If 2m / n is greater than one,
the reference line doesn't appear on your plot because leverage values
are always between 0 and 1.
Example Output |

|


Interpretation |

|
This example has two residual versus leverage plots, one for moisture
and one for fat. Brushing the graph identifies points that may be outliers
or have high leverage.
· In
the plot for moisture, soybean samples 41 and 42 are to the right of the
vertical line, which indicates they have extreme leverage values. Soybean
samples 22 and 36 are above the top horizontal line, indicating they are
outliers. These points are also outliers on the residual versus fit plot.
· In
the plot for fat, soybean samples 41 and 42 are again leverage points,
indicated by their position to the right of the vertical line. Soybean
samples 27, 18, and 39 are outliers, indicated by their position above
and below the horizontal reference lines. Sample 39 is also an outlier
on the residual versus fit plot.

