|
|
Stability StudyResidual Plots - Residuals versus Order |
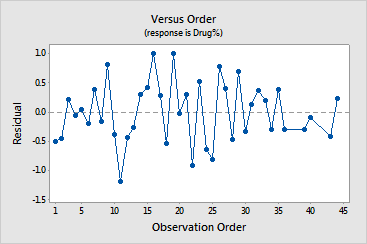
This graph plots the residuals in the order of the corresponding observations. The plot is useful when the order of the observations may influence the results, which can occur when data are collected in a time sequence or in some other sequence, such as geographic area.
The residuals in the plot should fluctuate in a random pattern around the center line. Examine the plot to see whether any correlation exists between error terms that are near each other. Correlation among residuals may be signified by the following:
Example Output |

Interpretation |
For the pill data, the residuals appear to be randomly scattered about zero.