main topic interpreting results session command see also
Suppose a vendor supplies pens with your company logo that you give away at trade shows. You receive the pens in lots of 5000 and have just implemented a sampling plan to inspect 52 pens. If the number of defectives is 2 or less, you accept the entire shipment. Assume the AQL is 1.5% and the RQL is 10%.
Your manager has objected to this plan and thinks that you should send the pens back if any defectives are found. You compare the current plan to his proposed one to highlight the risks and benefits of each plan.
1 Choose Stat > Quality Tools > Acceptance Sampling by Attributes.
2 Choose Compare user defined sampling plans.
3 In Measurement type, choose Go / no go (defective).
4 In Units for quality levels, choose Percent defective.
5 In Acceptable quality level (AQL), enter 1.5. In Rejectable quality level (RQL or LTPD), enter 10.
|
Note |
When comparing sampling plans, it is not necessary to specify AQL and RQL, as it is when you create a sampling plan. |
6 In Sample sizes, enter 52. In Acceptance numbers, enter 0 2.
7 In Lot size, enter 5000.
8 Click OK.
Session window output
Acceptance Sampling by Attributes
Measurement type: Go/no go Lot quality in percent defective Lot size: 5000 Use binomial distribution to calculate probability of acceptance
Acceptable Quality Level (AQL) 1.5 Rejectable Quality Level (RQL or LTPD) 10
Compare User Defined Plan(s)
Sample Acceptance Percent Probability Probability Size(n) Number(c) Defective Accepting Rejecting AOQ ATI 52 0 1.5 0.456 0.544 0.676 2745.2 52 0 10.0 0.004 0.996 0.041 4979.3
52 2 1.5 0.957 0.043 1.420 266.2 52 2 10.0 0.097 0.903 0.956 4521.9
Sample Acceptance At Percent Size(n) Number(c) AOQL Defective 52 0 0.693 1.887 52 2 2.603 4.300
Accept lot if defective items in n sampled ≤ c; Otherwise reject. |
Graph window output
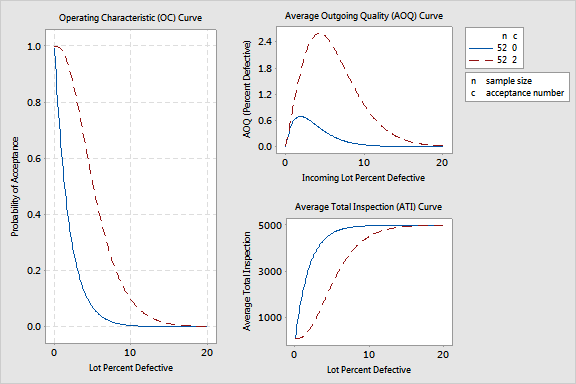
Graphs - Acceptance Sampling by Attributes

When the acceptance number is at zero (like a zero-defectives program), the probability of accepting a lot at the AQL is too low to be practical in a sampling plan. In this case, the AQL is 1.5%, there is only a 0.456 probability of accepting lots at this defective level. When the sampling plan was set up, the consumer and supplier agreed that lots of 1.5% defective would be accepted approximately 95% of the time.
If you want to improve the quality of the pens that you receive, you need to work with your supplier to do that and will need to develop a new sampling plan that takes into account the lower level of defectives expected. To assure the improved quality level, you will have to inspect more pens from the same lot size of 5000.