main topic interpreting results session command see also
Suppose a vendor supplies pens with your company logo that you give away at trade shows. You receive the pens in lots of 5000 and have been frustrated by the fact that many of them don't work properly. You decide to implement a sampling plan so you can either accept the entire lot or reject the entire lot. You are hoping to send a message to your supplier that poor quality pens will not be accepted. You and the supplier agree that the AQL is 1.5% and the RQL is 10%.
1 Choose Stat > Quality Tools > Acceptance Sampling by Attributes.
2 Choose Create a sampling plan.
3 In Measurement type, choose Go / no go (defective).
4 In Units for quality levels, choose Percent defective.
5 In Acceptable quality level (AQL), enter 1.5. In Rejectable quality level (RQL or LTPD), enter 10.
6 In Producer's risk (Alpha), enter 0.05. In Consumer's risk (Beta), enter 0.10.
7 In Lot size, enter 5000.
8 Click OK.
Session window output
Acceptance Sampling by Attributes
Measurement type: Go/no go Lot quality in percent defective Lot size: 5000 Use binomial distribution to calculate probability of acceptance
Acceptable Quality Level (AQL) 1.5 Producerís Risk (α) 0.05
Rejectable Quality Level (RQL or LTPD) 10 Consumerís Risk (β) 0.1
Generated Plan(s)
Sample Size 52 Acceptance Number 2
Accept lot if defective items in 52 sampled ≤ 2; Otherwise reject.
Percent Probability Probability Defective Accepting Rejecting AOQ ATI 1.5 0.957 0.043 1.420 266.2 10.0 0.097 0.903 0.956 4521.9
Average outgoing quality limit (AOQL) = 2.603 at 4.300 percent defective. |
Graph window output
Graphs - Acceptance Sampling by Attributes

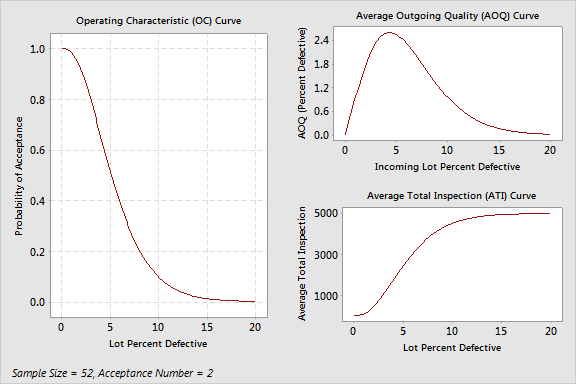
For each lot of 5000 pens, you need to randomly select and inspect 52 of them. If you find greater than 2 defectives among these 52 pens, you should reject the entire lot. For 2 or less defective pens, accept the entire lot.
In this case, the probability of acceptance at the AQL (1.5%) is 0.957 and the probability of rejecting is 0.043. When the sampling plan was set up, the consumer and supplier agreed that lots of 1.5% defective would be accepted approximately 95% of the time to protect the producer. The probability of accepting at the RQL (10%) is 0.097 and the probability of rejecting is 0.903. The consumer and supplier agreed that lots of 10% defective would be rejected most of the time to protect the consumer.
Acceptance sampling processes usually require corrective action when lots are rejected. When the corrective action is to perform 100% inspection and rework the defective items, the Average Outgoing Quality (AOQ) represents the average quality of the lot and the Average Total Inspection (ATI) represents the average number of inspected items after additional screening.
The AOQ level is 1.4% at the AQL and 1.0% at the RQL. This is because when lots are very good or very bad the outgoing quality will be good because of the rework and reinspection for poor lots. The Average Outgoing Quality Limit (AOQL) = 2.603 at 4.300 percent defective represents the worse case outgoing quality level.
The ATI per lot represents the average number of pens inspected at a particular quality level. For the quality level of 1.5% defective, the average total number of pens inspected per lot is 266.2. For the quality level of 10% defective, the average total number of pens inspected per lot is 4521.9.