main topic interpreting results session command see also
You have implemented a variables sampling plan to verify the pipe wall thickness of incoming 2" pipe. The lower specification for the wall thickness of the piping is 0.09". You and the supplier agree that the AQL is 100 defectives per million and the RQL is 300 defectives per million. Based on these specifications, you need to randomly select and measure 104 pipes of the 2500 per lot. If the calculated Z value is greater than the critical distance (3.55750), you can accept the entire lot. See Example of creating a variables acceptance sampling plan.
Because you have not been doing any kind of structured inspection before, the shift supervisor thinks this will take too much time. He suggested that you sample about 50. While you think this is too low, you agree to examine a few different possibilities to highlight the risks and benefits of each plan.
1 Choose Stat > Quality Tools > Acceptance Sampling by Variables >Create / Compare.
2 Choose Compare user defined sampling plans.
3 In Units for quality levels, choose Defectives per million.
4 In Acceptable quality level (AQL), enter 100. In Rejectable quality level (RQL or LTPD), enter 300.
|
Note |
When comparing sampling plans, it is not necessary to specify AQL and RQL, as it is when you create a sampling plan. |
5 In Sample sizes, enter 50 75 100 104. In Critical distance (k values), enter 3.55750.
6 In Lower spec, enter 0.09.
7 In Historical standard deviation, enter 0.025.
8 In Lot size, enter 2500.
9 Click OK.
Session window output
Acceptance Sampling by Variables - Create/Compare
Lot quality in defectives per million
Lower Specification Limit (LSL) 0.09 Historical Standard Deviation 0.025 Lot Size 2500
Acceptable Quality Level (AQL) 100 Rejectable Quality Level (RQL or LTPD) 300
Compare User Defined Plan(s)
Sample Critical Defectives Probability Probability Size(n) Distance(k) Per Million Accepting Rejecting AOQ ATI 50 3.5575 100 0.873 0.127 85.6 360.4 50 3.5575 300 0.187 0.813 54.9 2042.6
75 3.5575 100 0.919 0.081 89.1 271.3 75 3.5575 300 0.138 0.862 40.1 2165.8
100 3.5575 100 0.947 0.053 90.9 227.5 100 3.5575 300 0.104 0.896 30.0 2250.3
104 3.5575 100 0.950 0.050 91.1 223.2 104 3.5575 300 0.100 0.900 28.6 2261.3
Sample Critical At Defectives Size Distance(k) AOQL Per Million 50 3.5575 96.8 148.3 75 3.5575 101.0 141.9 100 3.5575 104.2 140.1 104 3.5575 104.6 140.0
Z.LSL = (mean - lower spec)/historical standard deviation Accept lot if Z.LSL ≥ k; otherwise reject. |
Graph window output
Graphs - Acceptance Sampling by Variables

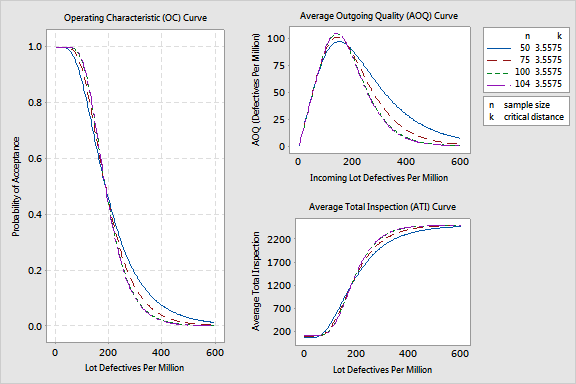
Comparing these graphs, you can easily make a case for reducing your sample from 104 to an even 100. The probability of acceptance at the AQL and the RQL only changes by less than 0.5% (0.95 - 0.947). Also the AOQ change as well as the ATI change is minimal.
You also decide that a sample size of 50 will not protect you, the consumer, or the producer well enough. With a sample size of 50, you have a 18.7% probability of accepting a lot at the RQL (300 PPM), too high for your comfort. Also, you have a 12.7% probability of rejecting a lot that should be accepted at the AQL (100 PPM), too high for your producer.
You need to think about the scenario of sampling 75 pipes a bit more. The risks associated with the probabilities of acceptance seem reasonable, considering you had not been doing any sampling before. You also know that your supplier is working to decrease pipe thickness variability and will be doing more monitoring at his site. So you decide to call together all the parties involved and make an informed decision considering all these things. Perhaps you will choose a sample size somewhere between 75 and 100.